From User Data to UX Insights: Improving User Satisfaction
What 50,000 User Sessions Taught Us About Bad UX.
Using Deep Machine Learning and behavioural analytics to uncover patterns behind user drop-off and surface actionable UX insights.
My Role: Business Analyst
The Problem
The goal was to understand what drives user satisfaction in digital experiences using behavioral data. Instead of relying on assumptions, I analyzed how users click, scroll, and navigate across a platform to identify patterns linked to satisfaction.
The challenge was that satisfaction isn’t directly visible in raw behavioral metrics — it emerges from how different actions interact over time. This required moving beyond surface-level metrics to uncover deeper behavioral patterns.
The Process
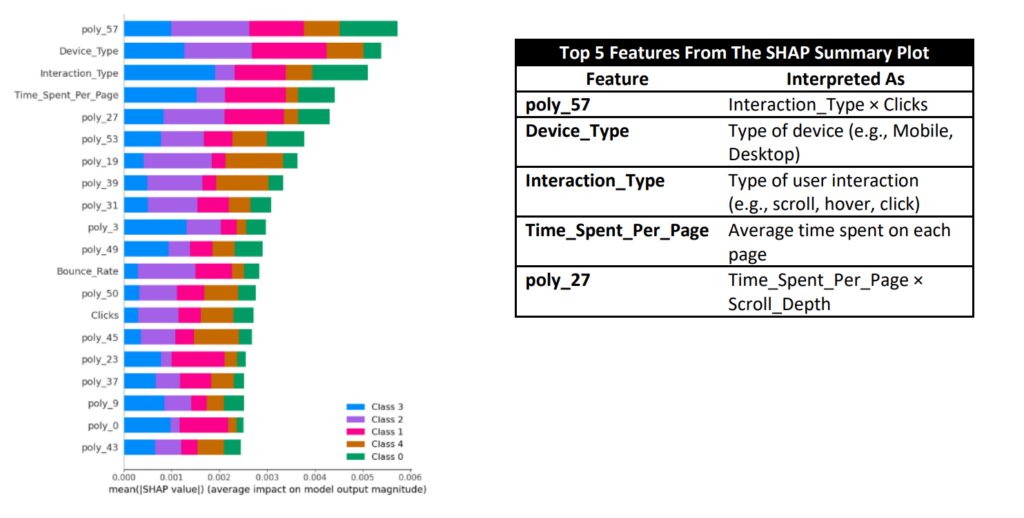
I worked with a dataset of 50,000 user sessions across 13 behavioral features, including clicks, session duration, scroll depth, device type, and feedback scores.
To explore relationships within the data, I applied machine learning models such as Random Forest, XGBoost, and neural networks, and used SHAP to understand which features and interactions had the strongest influence on user satisfaction levels.
Building on this, I conducted exploratory analysis using heatmaps, box plots, funnel analysis, and user transition mapping to identify where behavior diverged between higher and lower satisfaction experiences.
Key patterns emerged:
- During drops in user satisfaction, changes in Clicks, Session Duration, and Time Spent Per Page frequently co-occurred, suggesting that engagement-level disruptions — not isolated actions — drive dissatisfaction.
- Transitions from Button Click to deeper actions (Form Submit / Video Play) were common during satisfaction drops, showing that even high-intent interactions can break down due to poor experience quality.
- During low-satisfaction sessions, bidirectional patterns (e.g., Form Submit → Button Click → Form Submit) indicated task completion friction, where users repeat or backtrack actions instead of progressing smoothly.
- In sessions with lower satisfaction, increased time spent paired with reduced interaction depth (fewer clicks, shallow navigation) pointed to confusion, content overload, or unclear information hierarchy.
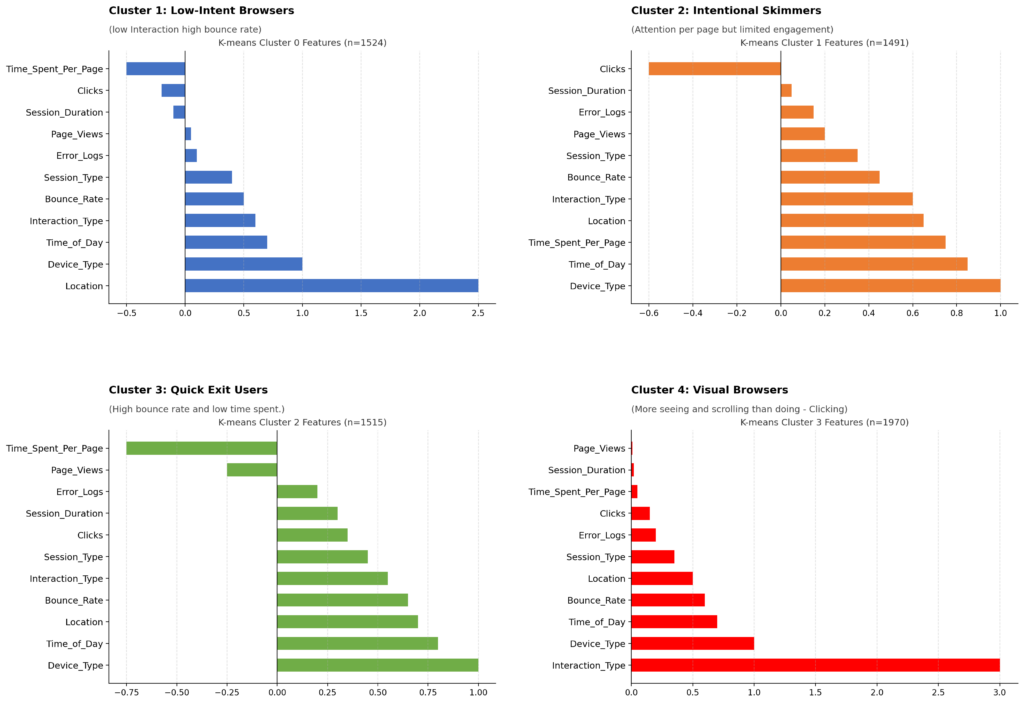
I also used K-Means clustering to segment users into distinct behavioral groups, each representing different interaction styles and needs.
The Outcome
Seven UX interventions derived from behavioral patterns and user segmentation:
- Design adaptable experiences that cater to key behavioral segments (e.g., skimmers, quick-exit users, visual browsers). For example, skimmers benefit from summaries, key highlights, and “jump to section” navigation.
- Introduce real-time guidance during high-intent actions (form submissions, video interactions) to prevent drop-offs at critical interaction points.
- Redesign task flows to reduce backtracking, with clearer progression states and feedback to minimize repeated actions.
- Add engagement depth cues (progress indicators, section markers) to support users navigating long or complex content.
- Improve video interaction UX with clearer affordances, loading feedback, and contextual previews.
- Use session-level behavioural shifts (multiple metric changes) to trigger timely support before satisfaction drops.
- Expand data collection to include qualitative signals and task-level feedback to better capture experience quality.
The Impact
By training predictive models on 50,000 sessions, the system can now anticipate user satisfaction levels in real time — flagging at-risk sessions based on behavi signals before dissatisfaction is ever expressed. Combined with seven targeted design interventions, this shifts the product team from reacting to complaints to proactively resolving friction, creating experiences that respond to how users actually behave rather than how they’re assumed to.